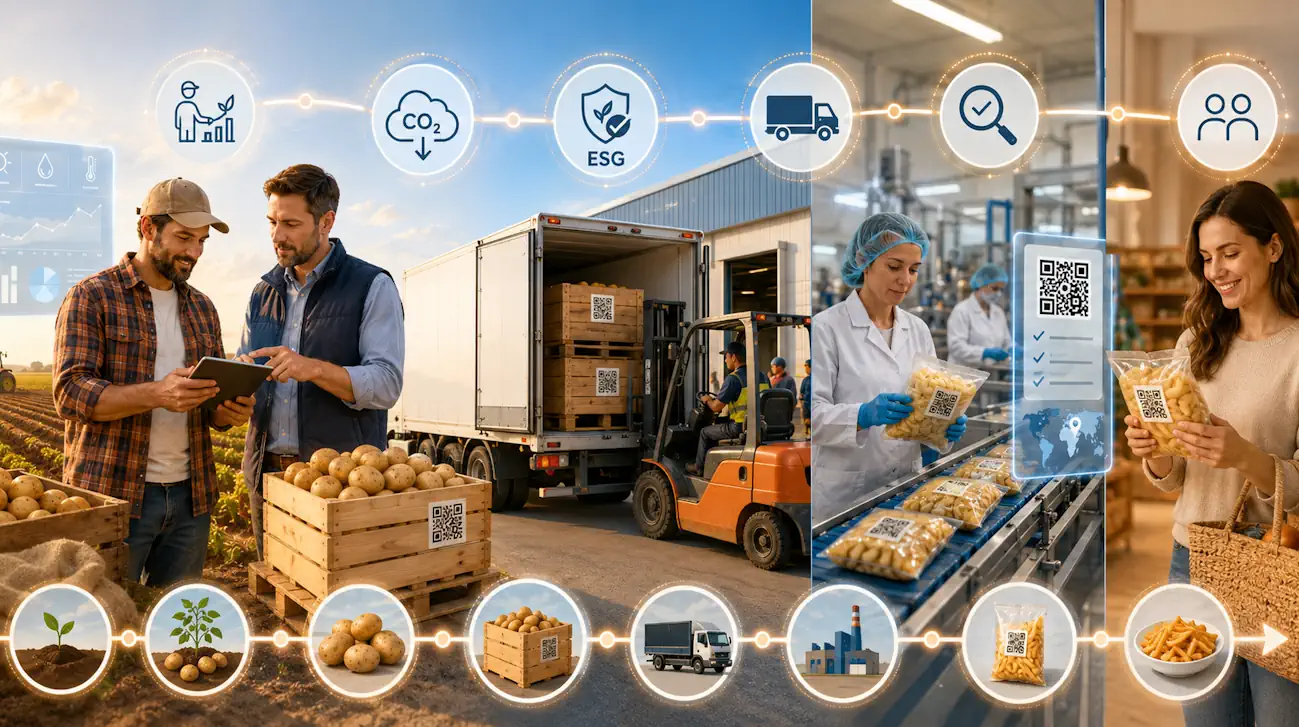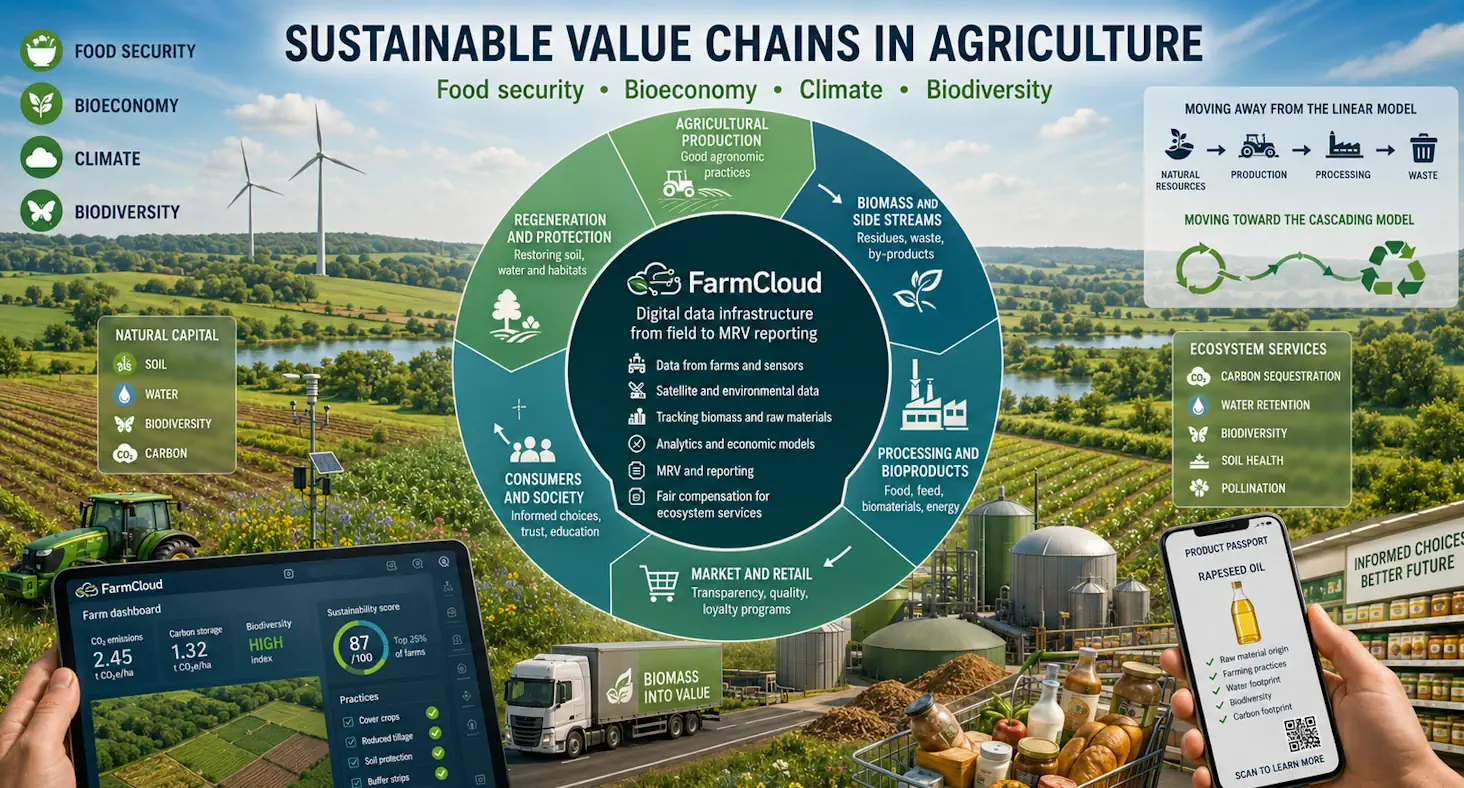
Food producers, regulators, non-governmental organisations and agricultural input suppliers must simultaneously protect food security, develop the bioeconomy, reduce emissions and restore biodiversity — four goals that sound coherent in policy documents, but can conflict at farm level. Without a shared data layer connecting agronomic practices, natural capital and biomass flows, none of these goals can be operationalised effectively. FarmCloud provides this layer — from field-level data to MRV reports and fair remuneration models for farmers delivering ecosystem services.
Summary
Food producers, regulators, non-governmental organisations and agricultural input suppliers must simultaneously protect food security, develop the bioeconomy, reduce emissions and restore biodiversity — four goals that sound coherent in policy documents, but can conflict at farm level. Without a shared data layer connecting agronomic practices, natural capital and biomass flows, none of these goals can be operationalised effectively. FarmCloud provides this layer — from field-level data to MRV reports and fair remuneration models for farmers delivering ecosystem services.
Key findings at a glance
For readers who open this article without time to read the full text, the key facts rest on three pillars: the scale of the bioeconomy, the undervaluation of ecosystem services and the operational data gap. Together, these three elements define the space in which new business models will emerge.
- Sectors producing and processing biomass generated EUR 863 billion in value added in the EU in 2023, equal to 5.0% of GDP, and supported 17.1 million jobs, equal to 7.9% of employment. [JRC, 2024]
- The estimated value of ecosystem services in the EU in 2019 exceeded EUR 234 billion — roughly equivalent to the combined value added of agriculture and forestry. [JRC INCA / ECB, 2024]
- Natural capital accounting at farm level is a prerequisite for operationalising payments for carbon sequestration, water retention and biodiversity.
- FAO estimates that around one third of global food production becomes loss or a side stream — a foundation for new value chains in the cascading bioeconomy.
- Without a digital layer connecting farmers, advisors, processors and retailers, loyalty and compensation programmes become discounts — not tools for changing practices.
Market problem: four pressures on one farm
Over the last three years, Polish and European farms have started receiving signals from four directions at the same time: from retailers (product passport, carbon footprint), from regulators (CSRD, CAP eco-schemes, Biodiversity Strategy 2030), from agricultural input suppliers (new partnership programmes instead of simple discounts) and from banks and insurers (ESG ratings, loans linked to soil regeneration).
Each of these signals makes sense. Together, however, they create what consultants call compliance fatigue. Farmers, distributors and crop protection manufacturers react in the same way: there is no tool that can turn these requirements into a single, coherent source of data serving all parties.
Below are three examples we hear most often from clients. They sound different, but they are the same problem.
- A producer processing rapeseed into edible oil: a retail chain expects documented sourcing from farms using cover crops and a limited number of treatments. Without a field-level data layer, the documentation ends with a declaration.
- A fertiliser producer: its downstream customers request Scope 3 data for every tonne of product. Estimates are no longer sufficient — data from specific farmer applications is needed.
- A dairy cooperative: a bank offers preferential working capital financing linked to an emissions reduction indicator among suppliers. Nobody knows how to measure it in an auditable way.
Each of these cases is solved in the same way: through digital infrastructure that collects farm data, values natural capital and provides a report aligned with the requirements of the requesting party. The rest of this article shows how this mechanism works in practice and what it means for specific stakeholder groups.
Market context: the EU bioeconomy in numbers
The concept of the bioeconomy has been present in policy for more than a decade, but only recent reports from the European Commission’s Joint Research Centre have shown the scale of the phenomenon using a unified methodology. Sectors using biomass now generate a significant part of EU GDP, while R&D expenditure in this area is growing faster than the average for the economy.
Three numbers structure the discussion. The first is the bioeconomy’s contribution to EU GDP. The second is the value not captured in conventional accounts. The third is the pace of R&D, which shows where investment is moving.
| Indicator | 2023 value | Share |
|---|---|---|
| Value added of biomass-producing and biomass-processing sectors | EUR 863 billion | 5.0% of EU GDP |
| Employment in bioeconomy sectors, narrow definition | 17.1 million people | 7.9% of EU employment |
| Value added in the broad bioeconomy, including services | EUR 1.9–2.7 trillion | 11–16% of EU GDP |
| R&D expenditure in biomass-based sectors | EUR 17.3 billion | 6.7% of EU business R&D |
| Value of ecosystem services in the EU, 2019 | EUR 234 billion | ≈ value added of agriculture + forestry |
Table 1. Scale of the EU bioeconomy and ecosystem services not captured in conventional accounts. Sources: European Commission Joint Research Centre (JRC, 2024), European Central Bank — Economic Bulletin 2024.
These numbers have three implications for the sector. First, the bioeconomy is not a niche — it is the second-largest segment of the EU economy based on natural resources. Second, ecosystem values are real, but they do not appear on invoices, so they do not enter commercial decision-making. Third, financial institutions, regulators and retailers increasingly expect suppliers to demonstrate environmental impact in a measurable way.
Where real value-chain tensions emerge
Four goals — food security, the bioeconomy, climate and biodiversity — are easy to list together. It is harder to recognise that, at operational level, they may conflict with one another. Without understanding these tensions, every policy intervention or commercial programme becomes a zero-sum game.
Food security versus the bioeconomy
Competition for biomass between food, feed, biofuels and bioproducts creates what economists call leakage — the displacement of food production to other areas or countries. Growth in demand for industrial biomass without constraints on land supply leads either to higher food prices or to pressure to convert ecosystems. This tension is particularly important for NGOs and regulators.
Climate versus biodiversity
Energy plantations that are good for the climate can simultaneously reduce biodiversity if they replace mosaic landscapes. On the other hand, agroforestry, cover crops and in-field tree planting can deliver both benefits, but they conflict with a model focused on maximising unit yield. The decisive point is system design at landscape scale, not at the level of a single field.
Fair income versus the cost of transition
Regenerative practices can increase soil organic carbon content by 0.5–1 tonne per hectare per year — a figure frequently cited in Polish and European sector studies — but they require investment that farmers will not recover unless there is a market for remunerating ecosystem services. Without infrastructure for valuing this work, it remains a donation to society.
Natural capital accounting at farm level
Natural capital accounting (NCA) is a system for measuring the condition and changes of natural assets and valuing the services they provide. At EU level, this is developed through the European Commission’s INCA project. For an individual farm, however, operational data is needed — data that is not present in a conventional ERP system.
In practice, a farm-level natural capital account requires the integration of several data layers. Together, they allow the farmer’s contribution to food and environmental security to be valued in a way that can be reported, audited and — most importantly — remunerated.
| Data layer | Source | Purpose |
|---|---|---|
| Field boundaries and land use | GIS, LPIS data, farmer declarations | Identification of asset scope |
| Soil condition (carbon, NPK, pH, structure) | Laboratory analyses + IoT probes | Measurement and forecasting of sequestration |
| Agronomic practices | Treatment log, machinery integration | Emissions balance, MRV |
| Landscape biodiversity | Habitat maps, satellite monitoring | Ecosystem indicators |
| Yields and biomass flows | FMS, integrations with buyers | Mass balance, value cascades |
| Economic indicators | Invoices, ERP, KSeF | Valuation, profitability |
Table 2. Data layers required for farm-level natural capital accounting. Own elaboration based on the UN SEEA EA methodology and INCA, European Commission.
Without integrating these layers, the environmental report of a farm remains a set of estimates. With integration, it becomes a document that can support remuneration for ecosystem services, ESG financing or supply contracts within a product passport value chain.
Where fair farmer income should come from
For several years, the market has been experimenting with business models in which farmers generate income beyond conventional food and feed production. None of these models works in isolation — they work as a package, and their common denominator is data.
Five sources of income beyond crop sales
The sources below are not speculative — they already operate in selected countries or as EU-funded pilot programmes. The difference lies in the readiness of the digital infrastructure required to scale them.
- Payments for ecosystem services — remuneration for carbon sequestration, water retention, pollination and reduction of nitrate runoff.
- Biomass cascades — sale of harvest residues, straw and cover-crop biomass to biorefineries and biogas plants.
- Product passport programmes — a premium for documented raw material origin with a lower environmental footprint, such as “regenerative-grade” flour or low-emission milk.
- Partnership programmes of agricultural input producers — sharing benefits with fertiliser, crop protection and seed suppliers in exchange for purchasing consistency and operational data.
- Landscape certification and agroforestry — biodiversity credit markets, already regulated in some countries such as France and the United Kingdom, and moving towards standardisation in the EU.
Biomass side streams: the economics missing from the balance sheet
FAO estimates that around one third of global food production is lost or becomes a side stream — a vast raw material base that does not exist in conventional farm accounting. The European Commission’s AgriForValor project already documented in 2018 that, in local ecosystems in Spain, Hungary and Ireland, side-stream biomass can become a source of new income models for farmers and foresters.
From a value-chain perspective, the problem is not the availability of side-stream biomass, but logistics, quality and traceability. Three conditions must be met for a side stream to become an industrial raw material:
- Volume and regularity — a biorefinery buyer needs delivery guarantees that a single farm cannot provide; a data aggregator covering hundreds of fields is needed.
- Quality characteristics — harvest residues differ in composition; without precise field-condition data, quality becomes a lottery.
- Traceability — a downstream processor, for example in cosmetics, packaging or construction materials, must prove the origin of the raw material in a way consistent with CSRD and the carbon border adjustment mechanism.
Each of these three conditions is solved with data. Without a digital layer integrating agronomic practices with mass balance and the biorefinery buyer, side-stream biomass will remain a disposal problem instead of a business opportunity.
What this topic changes for each stakeholder group
The four pressures — food security, the bioeconomy, climate and biodiversity — look different from the perspective of each stakeholder group. Below is a map of problems and benefits worth reading specifically through the lens of your own role.
Food producers and processors
Challenge: pressure from retailers and regulators for Scope 3 data, IFS/BRC audits increasingly covering environmental criteria, and the risk of losing contracts due to the lack of a product passport.
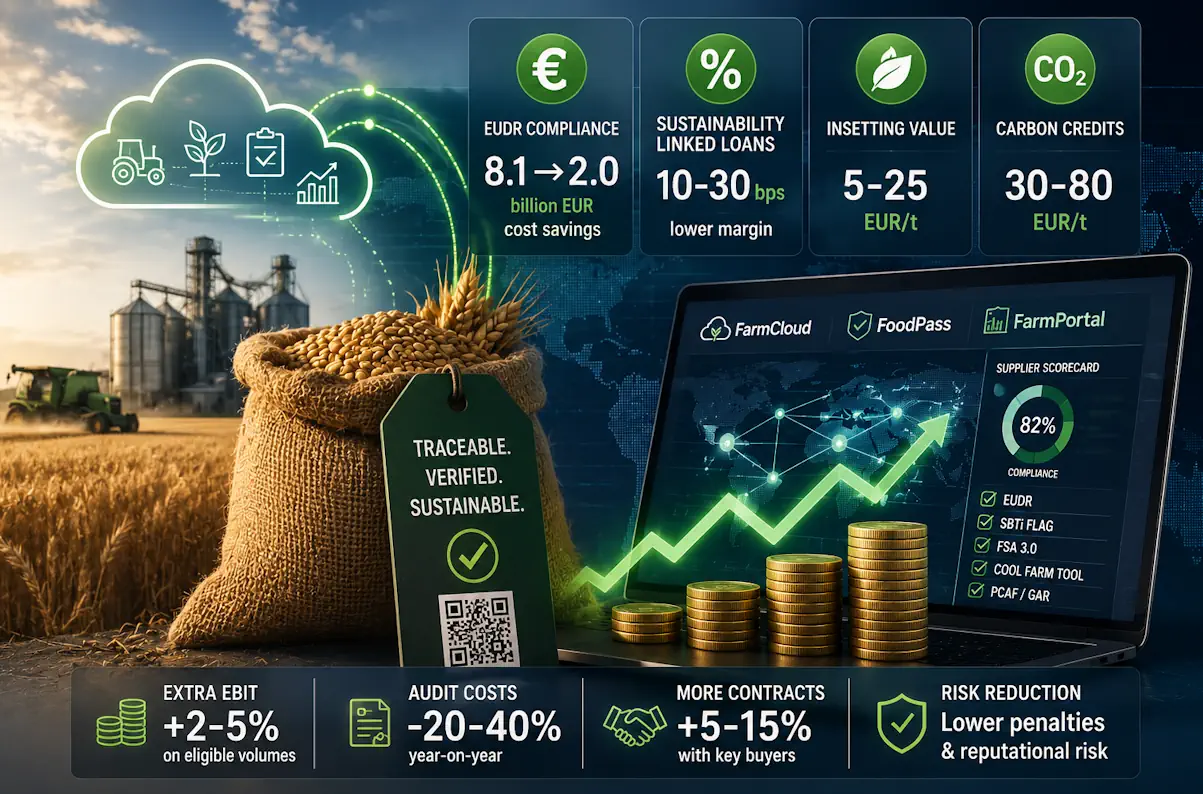
Benefits: access to aggregated field-level data, MRV documentation ready for CSRD reporting, a basis for negotiating premiums for raw materials with a lower environmental footprint, and a unified standard for supplier cooperation.
Non-governmental organisations and watchdog institutions
Challenge: lack of verifiable data to assess whether sustainability programmes are genuine or greenwashing; lack of a unified standard across companies; limited access to hard numbers for advocacy.
Benefits: standardisation of indicators, access to public reports aligned with the SEEA EA methodology, and the ability to participate in multi-stakeholder consortia as an evaluation partner.
Regulators and public institutions
Challenge: growing complexity of CAP policies, eco-schemes, the Green Deal and the Biodiversity Strategy 2030; limited data for tracking effects; the need for a coherent monitoring model.
Benefits: access to a data layer aligned with EU Bioeconomy Monitoring System standards, an empirical basis for designing eco-schemes and valuations for ecosystem services, and reduced audit costs.
Producers and distributors of agricultural inputs
Challenge: margin erosion on generic products, the requirement to provide environmental data to downstream customers, channel conflict between producer and distributor, and difficulty retaining farmers under price pressure.
Benefits: first-party farm data, a foundation for partnership and loyalty programmes based on real value rather than discounts alone, the ability to document Scope 3 for customers, and higher customer retention.
Sales and marketing teams, key account managers
Challenge: short conversations with farmers during the season, lack of insight into actual farm needs, price pressure from generics, and difficulty showing product value beyond price and packaging size.
Benefits: an agricultural CRM with advisory functionality — showing field condition, practice history and open cross-sell opportunities; ready-made conversation scenarios based on farm data; and the ability to manage a partnership programme from one dashboard.
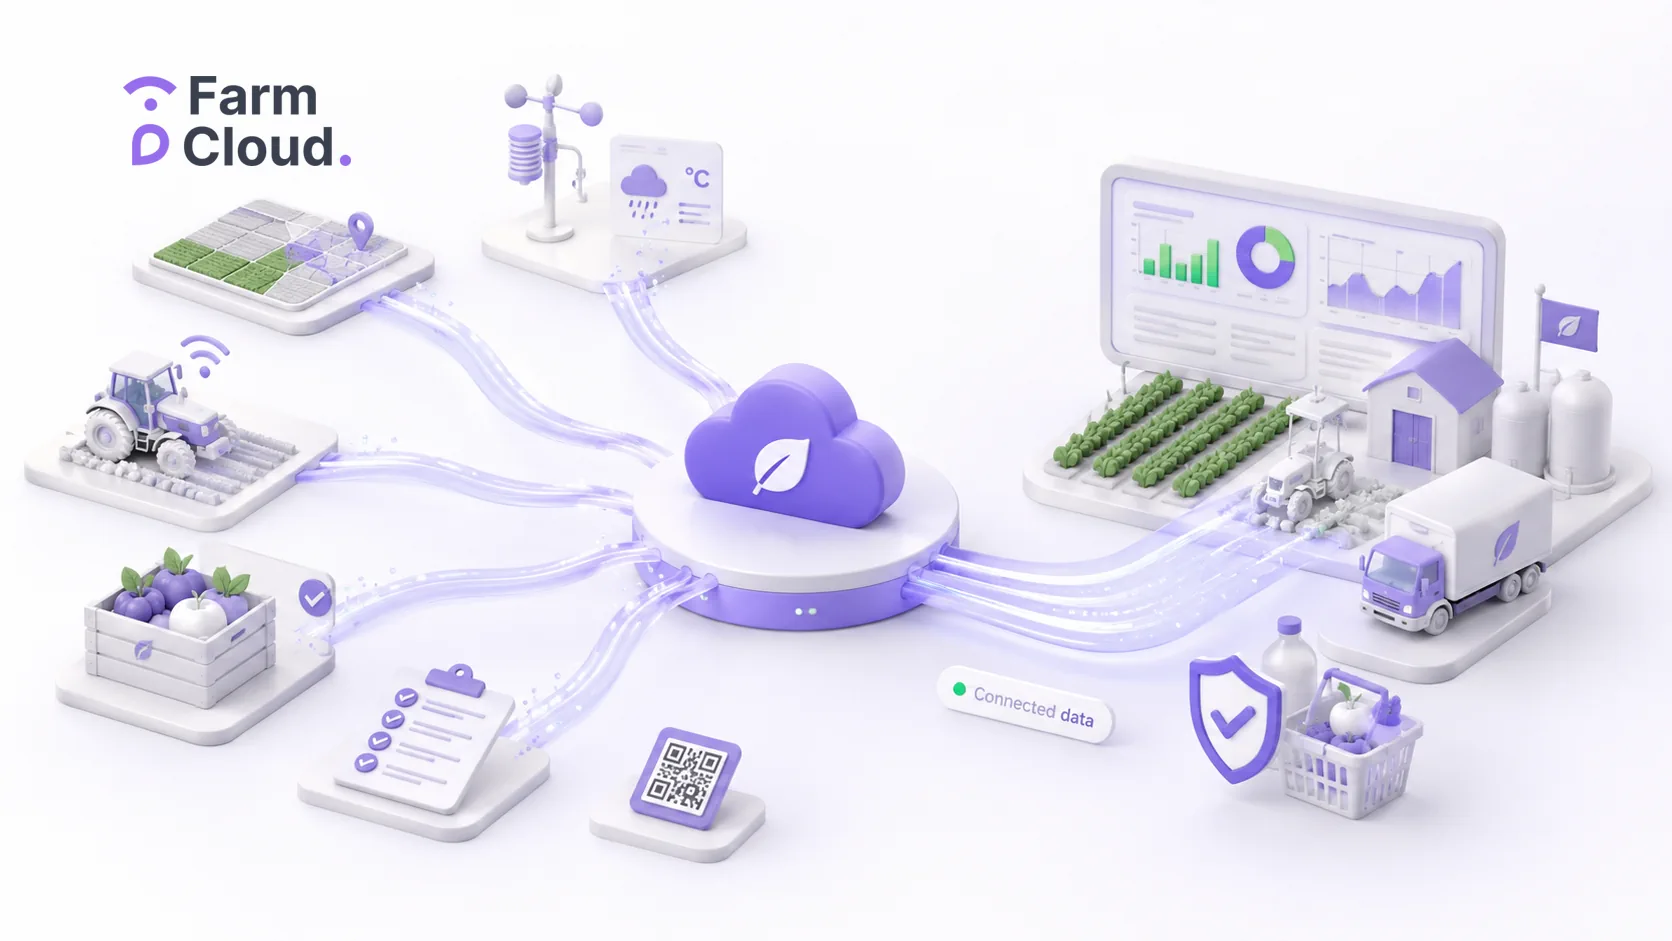
FarmCloud as digital infrastructure for the value chain
FarmCloud is a digital data infrastructure connecting farmers, agronomic advisors, processors and commercial buyers within a single platform. Three core applications operate within the platform, each supporting a different moment in the value chain — from the field to management reporting. The full list of features is available in the FarmCloud features section.
FarmPortal — the farm data layer
FarmPortal is a farm management system (FMS) available in web and mobile versions. It supports field records, crop planning, treatment logs, integrations with IoT sensors, weather stations, GPS and satellite data. It enables automatic calculation of CO₂ and nitrogen balances at field level.
FoodPass — the supply chain and product passport layer
FoodPass is an application for processors and distributors that connects them directly with supplier farms. It supports contracting, quality control, sample collection with laboratory integration and preparation for IFS, BRC and retailer requirements. It is also the foundation for the product passport and ESG/MRV reports.
Agri Insights — the analytics and reporting layer
For food producers, financial institutions and regulators, Agri Insights provides aggregated reports, predictive models and sector indicators based on real platform data. From a single report, users can view the emissions balance of the supply chain, geographic crop risk or the use of agricultural inputs.
What this means in practice for a value-chain operator
FarmCloud provides three key capabilities that a single ERP, a conventional CRM or an isolated carbon-footprint application cannot deliver at the same time:
- One data layer for multiple actors — farmers, advisors, processors, retailers and regulators work on the same data foundation with different permission levels.
- Built-in environmental indicators — emissions, carbon, nitrogen and water balances are generated automatically from treatment logs, without manual calculations.
- White-label and on-premise deployment options — partners can run the technology under their own branding, with full control over data.
We wrote more about how this infrastructure translates into emissions management and Scope 3 reporting in another article: managing supply-chain emissions with FarmCloud.
Comparison of value-chain tracking approaches
The decision on how to build value-chain visibility usually comes down to three options: extending an internal ERP/CRM, purchasing a standalone MRV or carbon tool, or deploying an integrated data platform. Each option has a different cost curve and a different thematic coverage.
| Criterion | Extended internal ERP/CRM | Standalone MRV / carbon tool | FarmCloud, integrated platform |
|---|---|---|---|
| Near-real-time field data | Requires separate integration | Limited to MRV | Yes, FarmPortal + IoT |
| Natural capital accounting | Must be built from scratch | Partially, carbon/nitrogen | Yes, integrated layers |
| Product passport and traceability | Not native | No | Yes, FoodPass |
| Multi-actor collaboration, farmer–processor–retailer | Difficult | No | Built in |
| Loyalty programmes and advisory CRM | Must be built | No | Yes, AgriCRM + AgroSell |
| Implementation | 12–24 months, high cost | 3–6 months, medium cost | 3–9 months, medium cost |
| White-label / on-premise option | Full, but expensive | Usually unavailable | Yes, available |
Table 3. Comparison of three approaches to operationalising value-chain tracking in agriculture. Own elaboration based on implementation project analysis in the agricultural input sector.
Seven mechanisms connecting food security with sustainable development
From an operational perspective, seven mechanisms connect the four goals with the daily activity of agri-food companies. Each of them can be implemented today with existing technology — what differs is the level of regulatory and market maturity.
- Product passport with environmental data — raw material supplied with emissions and practice documentation.
- Partnership programmes of agricultural input producers — rewarding farmers for purchasing consistency, data sharing and adoption of low-emission practices.
- Contracts with a carbon premium — processors pay extra for documented sequestration or emissions reduction.
- Payments for ecosystem services — valued through natural capital accounts and funded by the CAP, governments or business buyers.
- Side-stream biomass chains — sale of straw, residues and cover crops to biorefineries and biogas plants with guaranteed volumes.
- Biodiversity credits — a market still emerging, but already operating in pilots in France and the United Kingdom.
- Insurance models based on field data — parametric policies triggered by biophysical indicators from the platform.
Case study: an NPK producer in Central and Eastern Europe
Context
A medium-sized producer of nitrogen fertilisers and biostimulants, with annual turnover of around EUR 240 million and distribution in four countries in the region, faced three simultaneous challenges in 2024: pressure from downstream retail-chain customers to provide Scope 3 data, margin erosion on NPK products due to generic competition, and growing expectations from farmers for real value — not only price.
Challenge
A conventional discount programme did not solve any of these problems. Farmer data was dispersed among distributors, visibility into agronomic practices was missing, Scope 3 reports for downstream buyers were based on sector estimates rather than real operations, and attempts to build an internal CRM took more than a year without delivering results — the farmer had no reason to use it.
Solution
The producer launched its own partnership programme based on FarmCloud infrastructure in a white-label model. Farmers used FarmPortal as a free FMS, distributors were included in a commission-based programme, and the producer gained access to aggregated data through Agri Insights. Points were calculated automatically — from invoices, KSeF integrations and distributor confirmations.
Results after 24 months
| Indicator | Value after 24 months | Benchmark / control group |
|---|---|---|
| Number of registered farms | 4,180 | target: 3,500 |
| Total area covered | 178,000 ha | target: 140,000 ha |
| Share of wallet | 53%, up from 39% | control: 41% |
| YoY retention in the active segment | 86% | control: 67% |
| Scope 3 coverage, % of sales volume | 71% | before: 12% |
| Average improvement in nitrogen-use efficiency | +9.4% | sector benchmark: +3–6% |
| Implementation cost per farm | 47% lower | vs building an internal CRM from scratch |
| Reward cost as % of programme-covered sales value | 2.7% | budget: 3.0% |
| Net Promoter Score among participants | 54 | B2B agri sector average: 22–28 |
| Number of unlocked retail-chain contracts requiring carbon passporting | 2 | — |
Table 4. Indicators of the NPK producer’s partnership programme after 24 months of operation. Own elaboration based on a FarmCloud partner deployment, anonymised data.
What this shows
Three observations are worth retaining from this deployment. First, a farmer will not register for a loyalty programme — but will register for a free, useful FMS to which the programme is attached. Second, Scope 3 data emerges as a by-product of an operational system, not as a separate reporting project. Third, the distributor becomes a partner if they have their own KPIs and commission streams within the programme — otherwise they see the programme as a threat.
Voices from the market
“I run 320 hectares in Mazowieckie — maize, rapeseed, wheat and 40 hectares of peas. Previously, I had three applications: one for fields, one for invoices and one from my fertiliser supplier. I gave up two of them because FarmPortal covers all of this, and fertiliser points are calculated automatically from a photo of the invoice. This year, I used points to get a soil analysis voucher for 28 sampling points — real savings, plus fertilisation recommendations based on the actual composition of my field. The result: nitrogen use down by around 11%, yield maintained. The most important thing is that I do not have to register in another system just to receive a discount.”
“I work as a key account manager for a fertiliser producer — I manage 86 large farms. Preparing visits used to be the hardest part; without current field data, every conversation started with questions that irritated the farmer. With access to FarmCloud, approved by the farmer, I can see practice history, crop rotation and cross-sell potential. Conversion to the biostimulant package increased from 18% to 41% in the premium segment, and visit duration fell by one third. What I value most is that I do not have to compete only on price pressure, because we talk about a real agronomic problem.”
Implementation checklist for a value-chain operator
If you are planning to launch a programme based on farm data — a product passport, partnership programme or Scope 3 report — the steps below form a sequence worth following in this order. Skipping any of them creates costs that must be solved later.
- Define one measurable business objective for the programme, for example “cover 60% of Scope 3 by the end of 2027” — without this, the programme becomes abstract.
- Select a pilot region and 3–6 products; do not start with the full portfolio.
- Define the data policy: who is the controller, who has access and what consents are collected.
- Integrate the FMS with invoices and — in Poland — with KSeF, to avoid manual document collection.
- Design the partnership programme with the distributor: their commission must be built in, not assumed.
- Define indicators — share of wallet, retention, NPS, Scope 3 coverage, data quality — and measure them quarterly.
- Build seasonal communication into the agronomic calendar, not the marketing calendar.
- Design a reward policy with a built-in service component, such as soil analysis or advisory support — not only gadgets.
- Check the tax treatment of rewards before launch, including sales-promotion income tax rules and the PLN 2,000 threshold.
- Plan the scaling phase: pilot → optimisation → roll-out, with a minimum total horizon of 18 months.
Building trust: blockchain without overinterpretation
The word “blockchain” appears in almost every discussion about food passports, but it is worth being honest: in the EU regulatory environment, where official food inspection, sanitary control, public supervision and accounting obligations already exist, the problem of a “missing arbiter” is relatively small. Blockchain solves it in theory — in practice, coherent data and clear responsibilities matter more.
Where blockchain truly works is in detecting inconsistencies in the supply chain based on records distributed across multiple systems. In FarmCloud, we use this technology under the hood to detect product-passport fraud — for example, inconsistencies between declared acreage and reported volume. The client usually does not see the blockchain and should not need to — it is an internal data-quality control mechanism, not a marketing label.
In short: building trust in the value chain does not happen through a “secured by blockchain” sticker. It happens through auditability, unified field identifiers and multi-layer data validation. This is the real value delivered by the digital layer.
Questions and answers
How can food security be balanced with the bioeconomy when biomass competes for the same land?
The key is cascading design: food and feed first, followed by side streams and marginal land for high-margin biorefinery products. This requires monitoring biomass flows at macro scale, for policy, and micro scale, for management — which can be delivered through data infrastructure such as FarmCloud.
Can a fertiliser producer benefit from a farmer loyalty programme without creating conflict with the distributor?
Yes — provided that the distributor is included in the partnership programme with its own commission and data stream. Programmes in which the producer communicates with the farmer behind the distributor’s back lead to channel loss. FarmCloud supports three-party models — producer, distributor and farmer — with native role separation.
What is meant by natural capital accounting at farm level?
It is the structured measurement of the condition of natural assets on the farm — soil, water, biodiversity — and the valuation of the services they provide. Methodologically, it is based on the UN SEEA EA framework, the European Commission’s INCA project and sector-specific extensions for agriculture.
What data is needed to start a Scope 3 report for our customers?
The minimum dataset includes field boundaries, crop plan, treatment log covering fertilisers, crop protection products and fuel, yields, basic soil analyses and weather data. This is sufficient to calculate an emissions balance using a methodology aligned with ISO 14064 and the GHG Protocol Agriculture guidance. FarmCloud aggregates these data natively.
Can small and medium-sized farmers benefit from a programme based on natural capital accounting?
Yes, provided they do not have to carry out the accounting themselves. The value of FarmCloud infrastructure is that data enters the system from the farmer’s everyday work — treatment logs, invoices, IoT probes — while the report is generated automatically. Requiring manual accounting would eliminate most potential participants.
How can an NGO or public institution verify whether a company programme is not greenwashing?
Three markers are sufficient for a first screening: whether MRV documentation exists and is aligned with a recognised standard such as ISO 14064 or SBTi FLAG; whether the data is audited by an external party; and whether the report is publicly available in a format that enables comparative analysis. Digital infrastructure such as FarmCloud provides the evidence base for this type of verification.
How long does it take to implement a data layer in a medium-sized company?
Regional pilot: 3–6 months. Full deployment with ERP integrations, KSeF and historical data: 9–12 months. Scaling to the whole market: 18–24 months. The key challenge is not technology, but internal processes and field adoption.
How does a CRM for agriculture differ from a classic CRM such as Salesforce or HubSpot?
A classic CRM works with contacts, accounts and pipeline. An agricultural CRM within the FarmCloud layer works at the level of field, crop, season and environmental balance — the units that actually define agricultural business. It also embeds an advisory function: a key account manager sees not only purchase history, but also the agronomic condition in which the farmer operates.
Is harvest automation and machinery data part of this infrastructure?
Yes. FarmPortal integrates with GPS guidance systems, on-board sensors and automatic control systems, enabling near-real-time recording of machinery work and allocation of fuel use to specific fields — a key element for emissions reporting.
Does it make sense to deploy blockchain in the food chain?
Blockchain makes sense as an internal data-quality control mechanism and as a way to detect inconsistencies between systems, especially fraud. As a marketing tool, “trust through blockchain” does not replace what actually creates trust: auditability, unified identifiers and multi-layer validation.
Conclusion
The four pressures — food security, the bioeconomy, climate and biodiversity — will not be reconciled through declarations. They will be reconciled where a data layer connects field reality with economic accounting and regulatory reporting. Food producers, NGOs, regulators, agricultural input producers and key account managers speak from different perspectives, but they need the same thing: credible, auditable and flowing farm data.
FarmCloud was created in response to this deficit. It connects FarmPortal as the FMS, FoodPass as the supply-chain and product-passport layer, and Agri Insights as the analytics layer — in one platform that can be deployed as SaaS, on-premise or white-label. For a value-chain operator, this means that building fair business models for farmers, Scope 3 coverage or natural capital accounting infrastructure does not require starting from scratch. It requires a decision about what value we want to unlock, for whom and against which KPI it will be measured.
Glossary
- Food security
- A situation in which all people have continuous physical, social and economic access to sufficient, safe and nutritious food, according to the FAO definition. It includes four dimensions: availability, access, utilisation and stability.
- Bioeconomy
- Sectors that use renewable biological resources — plant, animal and forest biomass — to produce food, feed, materials, chemicals, energy and services, including biodiversity and ecosystems.
- Natural capital accounting, NCA
- A systematic method for measuring natural assets and valuing ecosystem services, developed under the UN SEEA EA framework, the System of Environmental-Economic Accounting.
- Ecosystem services
- The benefits that ecosystems provide to people — pollination, water retention, air purification, carbon sequestration, soil and landscape heritage.
- MRV, Monitoring, Reporting, Verification
- A standard for monitoring, reporting and verifying environmental indicators — emissions, sequestration and resource use — in an auditable way.
- Scope 3
- The third emissions scope under the GHG Protocol — indirect emissions in a company’s value chain, including upstream supplier emissions. For food companies, this is usually the largest category.
- Product passport
- A digital record of the origin, journey and parameters of a product in the supply chain — from field to shelf. In food, it is implemented as an extension of existing traceability systems.
- Biomass side stream
- Biomass generated as a by-product or waste in agricultural, forestry or food production, which can be used as raw material for other chains, such as biorefineries, biogas plants and materials.
- Biodiversity credits
- Market units representing a measured, verifiable contribution to biodiversity improvement in a given area, which can be sold to entities required to report or compensate environmental impact.
- Advisory CRM for agriculture
- A customer relationship management system for farms enriched with agronomic data — field condition, treatment history and recommendations — enabling sales teams and key account managers to conduct data-based conversations.
- White-label
- A deployment model in which a partner uses the provider’s technology under its own brand, with its own visual identity and communication rules, without exposing the technology owner to the end user.
- FMS, Farm Management System
- A farm management system integrating field records, crop planning, treatment logs, sensor data and agronomic decision support in one tool.
Sources
- European Commission, Joint Research Centre — The EU bioeconomy at a glance: Focus on economic value added, employment and innovation, JRC publication, 2024. Core data on the scale of the EU bioeconomy: EUR 863 billion in value added and 17.1 million jobs in 2023. publications.jrc.ec.europa.eu/repository/handle/JRC143759
- European Central Bank — Accounting for nature in euro area economic activity, Economic Bulletin Box, June 2024. INCA project data on the value of ecosystem services in the EU, at least EUR 234 billion in 2019. ecb.europa.eu/press/economic-bulletin/focus/2024
- FAO — The State of Food and Agriculture: moving forward on food loss and waste reduction, reference data on the scale of food losses and side streams in global food production, approximately one third of production.
Follow us!
Preview what we are doing and be inspired by positive changes.